Tracing Mathematical Patterns in Underground Card Game Networks Across Midwestern Cities
Kirjoittanut Leon Fischer · 23.9.2026
Tracing Mathematical Patterns in Underground Card Game Networks Across Midwestern Cities
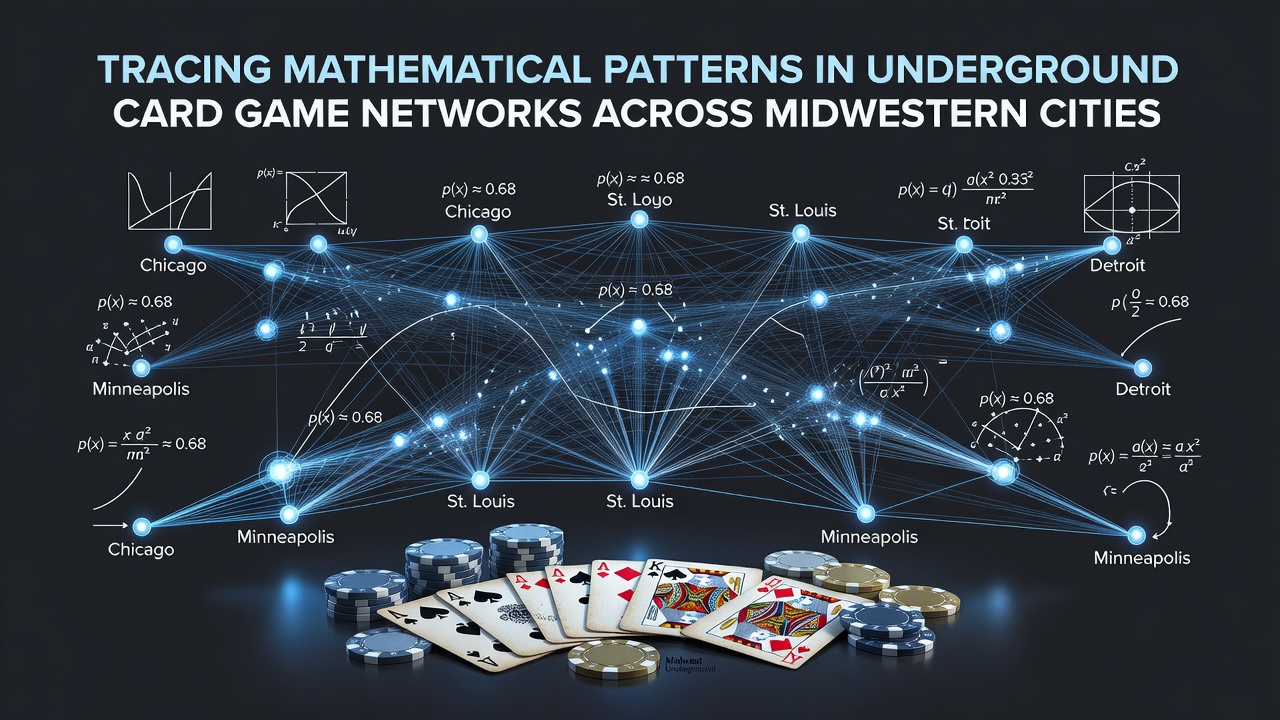
Analysts have documented recurring mathematical structures within underground card game operations that span Chicago, Detroit, Minneapolis, and St. Louis, and these structures emerge from repeated data captures during enforcement actions and confidential reporting systems. Network mapping techniques reveal clusters where individual games function as nodes connected by shared participants, financial flows, and information exchange, while centrality measures identify a small number of high-degree operators who link otherwise separate groups. Graph theory applications show that these networks often exhibit small-world properties, allowing short paths between distant cities despite limited direct contact.
Network Structures Observed in Major Cities
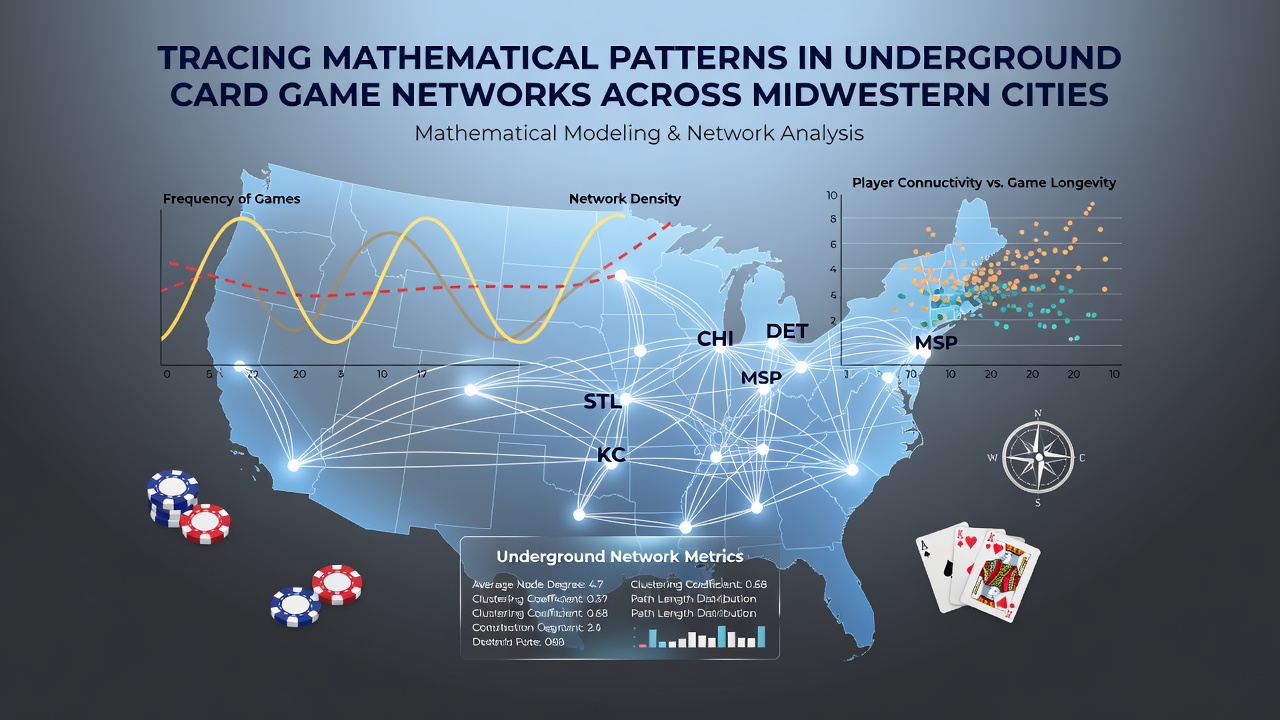
Data collected across enforcement operations indicates that Chicago-based operations frequently display dense local clusters with high clustering coefficients, yet they maintain bridge connections to Detroit and Indianapolis that appear in transaction records and participant movement logs. In Minneapolis and surrounding areas researchers note lower density graphs with longer average path lengths, suggesting more compartmentalized activity that still aligns with broader regional patterns through periodic high-stakes events. St. Louis networks demonstrate hybrid characteristics where river-adjacent locations serve as convergence points, and statistical analysis of betting volumes reveals power-law distributions in pot sizes that repeat across multiple sites.
September 2026 enforcement summaries released by regional task forces contained new datasets that allowed updated centrality calculations, and these calculations placed several previously peripheral operators into higher-connectivity positions after cross-referencing digital payment traces with physical surveillance records. The updated graphs showed increased betweenness scores for certain Midwest corridor routes, highlighting how seasonal fluctuations in activity correlate with changes in network topology.
Mathematical Methods Applied to Pattern Detection
Researchers apply community detection algorithms such as Louvain and spectral clustering to partition large datasets into subgroups that correspond to operational cells, and they validate these partitions against known arrest records and seized ledgers. Probability models built from historical hand histories estimate the likelihood of repeated participant pairings, while time-series analysis tracks how game frequency and location shift in response to external pressures like local ordinances or increased patrols. Bayesian inference frameworks help update node importance scores as new information arrives, producing dynamic visualizations that law enforcement units use for resource allocation.
One study released through the National Institute of Justice examined ten months of Midwest seizure data and found that eigenvector centrality rankings predicted subsequent network growth with measurable accuracy, and the same study noted that edge weights derived from cash volume provided stronger predictive signals than simple connection counts. National Institute of Justice publications detail these quantitative approaches without disclosing operational tactics.
Regional Variations and Data Integration
Comparative analysis across state lines shows that Illinois and Michigan networks share similar degree distributions yet differ in their response to regulatory changes, while Minnesota operations exhibit tighter geographic constraints that appear in shorter maximum path lengths within the graphs. Integration of public records from gaming commissions with anonymized enforcement data allows researchers to separate legal card room activity from underground overlays, and the resulting hybrid datasets improve the precision of anomaly detection routines. Observers note that September 2026 figures revealed a temporary spike in cross-border edges following major regional events, after which the graphs returned to baseline connectivity levels within six weeks.
Academic teams at multiple Midwest universities have contributed statistical frameworks that process heterogeneous data sources including phone records, financial ledgers, and location pings, and these frameworks rely on maximum likelihood estimation to infer missing links. The resulting models consistently identify recurring motifs such as star-shaped subgraphs centered on cash handlers and chain-like structures that move funds between cities.
Conclusion
Continued collection and mathematical analysis of network data from Midwestern underground card game operations produces increasingly detailed maps that reflect both persistent structures and short-term adaptations. Publicly available methodological reports from research institutions and government agencies document the quantitative tools applied, and these tools continue to evolve as additional datasets become accessible through coordinated multi-state efforts. The patterns identified so far demonstrate measurable regularities in connectivity, centrality, and temporal behavior that recur across different urban centers.